Calculating Alcohol Strength Like It's 1972
Imagine for a moment being a producer of fine spirits in the 1950’s. You’ve just shipped a large quantity of your best liquid to a merchant across the border. A few days later, you receive a letter from the customs office stating that the amount of alcohol declared is wrong. How can that be, you ask, the alcoholic strength of our liquid was tested in the presence of our beloved resident excise duty officer!?
You’re not alone. Many producers and merchants have this problem. See, your customs officers use one calculation to determine alcohol concentrations, but the colleagues on the other side of the border use their own calculations, and of course, they differ.
To solve this problem, the International Organization of Legal Metrology, or OIML for short and in French, decided to standardize the calculations underpinning various alcohol measurements such as ABV (alcohol by volume), to remove these pesky barriers to international trade. In 1972, they published their recommendation R22 International Alcoholometric Tables (PDF), which defined the computations to be used and gave tables with which everybody could work to obtain the same results. Various national organisations then proceeded to publish official versions of these tables to be used e.g. for tax purposes.
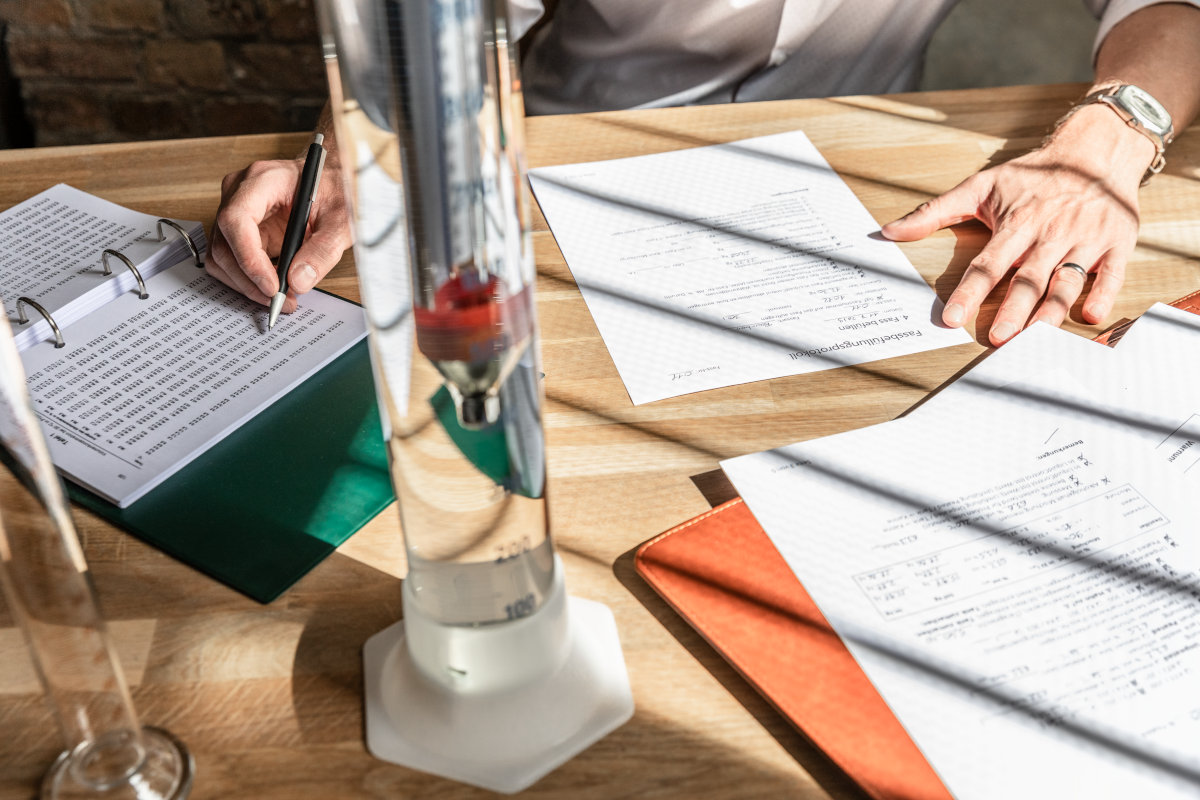
When you work with alcohol, you can either use a very expensive machine that quickly and accurately measures the alcohol content of a distilled spirit, or you go old-fashioned and low-budget and use an alcoholometer: a carefully manufactured cylindrical device made of glass featuring both a thermometer and a scale that you dip into your spirit. From the thermometer you read the temperature of your liquid, and from the length of the submerged portion of the scale, you read the apparent density at that temperature. You then use the official tables to find the true density at 20 °C, and thus the legally accepted alcohol content, of your liquid.
That’s how I used to do it as well, running my finger down long columns of numbers until I found the correct value.
Now, that’s fairly straightforward if your temperature and density readings match the headings of your table, which are listed with an increment of 0,1 each. If, however, your readings fall between those, it gets tricky. You now have to manually interpolate between four different values to get the correct number. And that takes time.
Fortunately, I’m a computer programmer by trade. That means that to me, every problem can be solved with software (well, almost every problem). But how to automate this calculation?
I found a couple of programs that did this. One of them was a 20-year-old Java program with a clunky Swing UI that I could only run after hunting down the appropriate Java runtime. Another one was a piece of open source Python code with dubious calculations and a stern but practical command-line interface. A third alternative was a commercial Windows application that looked even clunkier than the first one.
So I decided to go back to the original calculations. My alcoholometric tables did reference the source of its calculations: our famous OIML recommendation R22. I finally tracked down the document in its glorious, slightly skewed, scanned-from-a-photocopy quality, and started studying it.
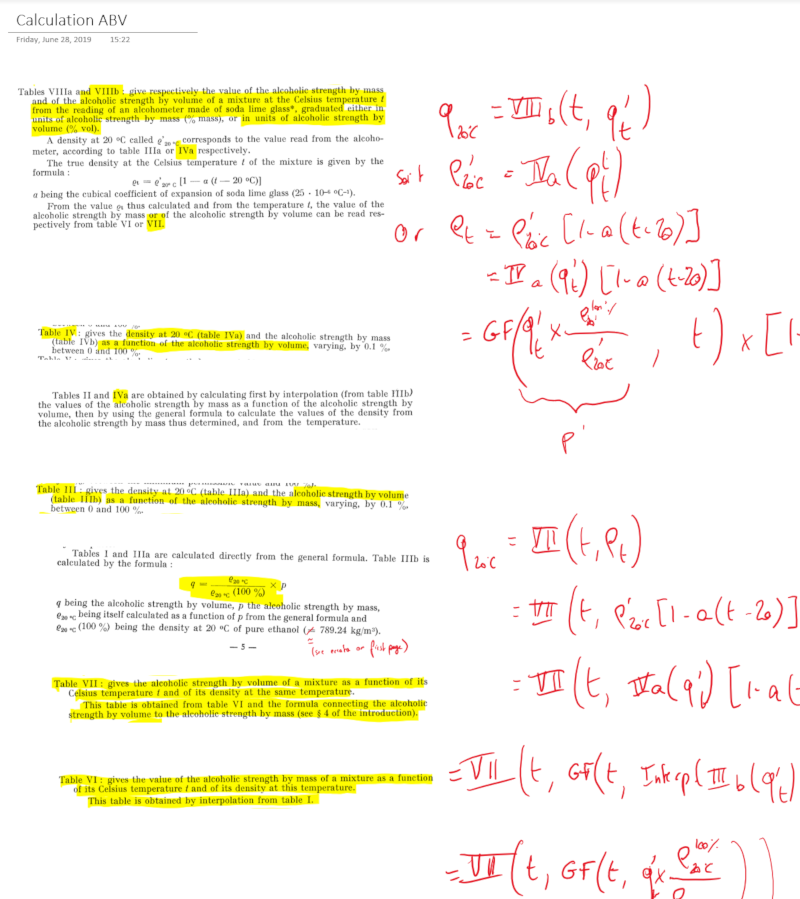
Eventually, I had a working Javascript implementation of the most important calculations. I proceeded to integrate them into a tool that matched my workflow when filling my customers’ casks, which made my daily work in the warehouse much easier, and never opened the old binder again.
You can try out a sample calculation right here in your browser: